Discover
Discover
Latest
What is the profit or loss for Blossom Residences
Blossom Residences has 10 profitable apartment/condo transactions ranging from $373,112 to $933,888 in profit. There have been no unprofitable transactions in the last 24 months. Click for more.
10 views
I want to view transactions for resale condo in 16 Amber Gardens
Recent resale condo transactions for Amber Park at 16 Amber Gardens:
1) 21/Aug/2025, #16-XX, 4BR, 1302 sqft, $2,909 PSF, $3,788,888
2) 14/Feb/2025, #17-XX, 3BR, 1109 sqft, $3,066 PSF, $3,398,888
3) 02/Dec/2024, #21-XX, 2BR, 678 sqft, $2,772 PSF, $1,880,000
Click for more.
7 views
Price trend chart for Dormer Park.
Price trend chart for Dormer Park over the last 16 quarters.

7 views
Semi-detached house in District 27
77 semi-detached houses available in District 27.
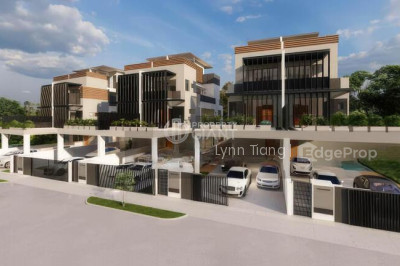
S$ 6,480,000SPRING WATERS VILLAS BRAND NEW SEMI-D MOVE-IN READY!
6 Beds
7 Baths
Semi-Detached
Jalan Mata Ayer
7000 sqft
S$ 926 PSF
D27
2024
S$ 5,000,000CHEAP FH SEMI-D IN SEMBAWANG
6 Beds
4 Baths
Semi-Detached
Goodlink park
5500 sqft
S$ 909 PSF
D27
S$ 6,480,000❤️GIANT⚡️CHEAP! LAST UNIT! LUXURY BRAND NEW SEMI-D WITH POOL
6 Beds
7 Baths
Semi-Detached
Jalan Mata Ayer
7000 sqft
S$ 926 PSF
D27
2024
5 views
Growth rate for Waterbay.
Waterbay (Condo) transaction price trend for the last 15 quarters.

3 people
7 views
I want to view transactions for resale condo near Outram Park MRT
Here are the last 10 resale transactions of apartment/condo properties near Outram Park MRT: Click for more.
9 views
What is the price trend comparison between CCR, RCR, and Core Central Region?
The graph shows the transaction price trend in CCR and RCR over the past 16 quarters.

13 views
What is the price trend comparison between CCR, RCR, and OCR for landed properties?
The graph shows the transaction price trend for landed properties in CCR, RCR, and OCR over the past 16 quarters.

17 views
What is the new launch price trend for CCR, RCR, and OCR?
The graph shows the transaction price trend for new launches in CCR, RCR, and OCR over the last 16 quarters.

136 people
23 views
Compare Seastrand and Ripple Bay.
The graph shows the transaction price trends for Ripple Bay and Seastrand condos over the past 16 quarters.

7 people
13 views